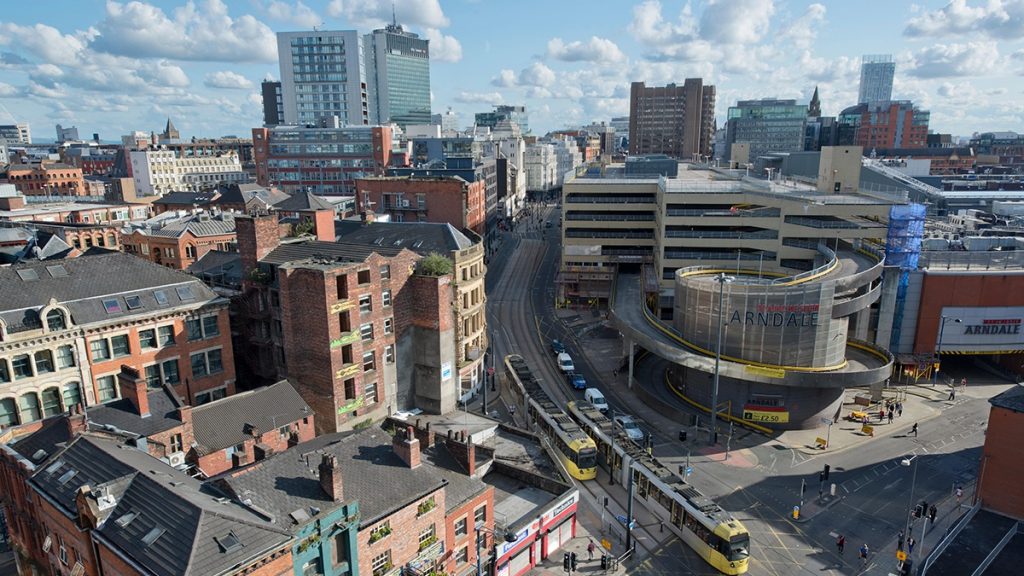
How has coronavirus changed cities? Using urban data to understand lockdown | Manchester Urban Observatory
What would happen if we could remove cars from our cities? Can we improve air quality to reduce vulnerability to Coronavirus? These are big questions with massive ramifications for public health, liveability and climate change. This post uses urban data to examine how Coronavirus has transformed the movement of people in cities, and what the impacts tell us about living in cities with fewer cars.
Urban data is more available and important than ever before and has become critical to everyone living in and managing cities. Thanks to the explosion in low-cost sensors and smart technology, many organisations now have sophisticated monitoring capabilities that enable them to capture data relating to traffic, air quality, pedestrian movements and noise. The Coronavirus emergency has also prompted large data holders like Google and Apple to open up their phone location data to help control the virus. These kinds of data have huge potential to understand and plan urban environments more effectively. Our work as part of the Manchester Urban Observatory has been funded by the government for exactly this reason.
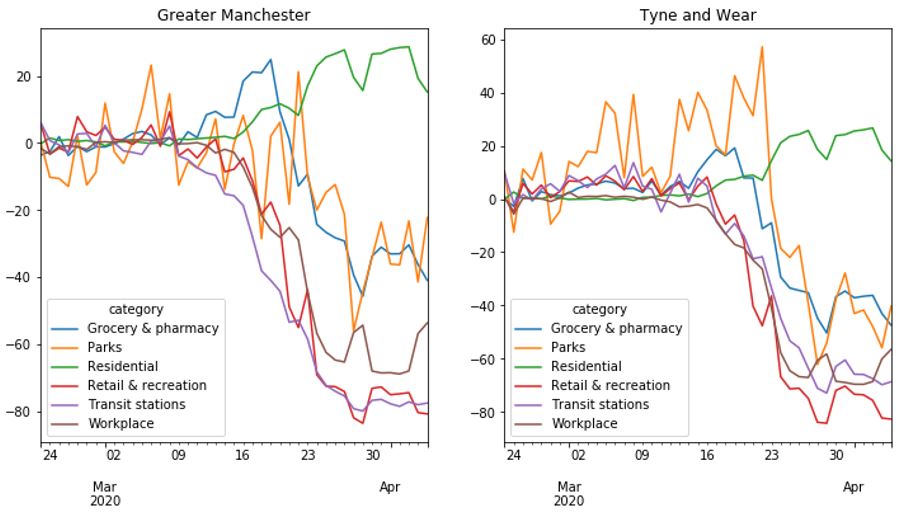
The first and most obvious role for data is to paint a picture of how lockdown has changed people’s movements. The graph below uses newly released Google data taken of phone locations to show changes in time spent by people in certain types of places over the course of March. For comparison, the graph on the left shows data for the Greater Manchester region, while that on the right shows data for Tyne and Wear. The zero point on the y-axis is the baseline, below which points represent the relative decrease in time spent. The government lockdown on the 23rd March is clearly shown by the rapid decrease in the time spent everywhere except for people’s homes. The pattern in both regions is extremely similar, indicating uniform levels of acceptance of the lockdown which is useful to policy-makers trying to track the effectiveness of lockdown measures. The exception is time spent in parks, which was far higher in the North East in the run-up to lockdown, which may reflect the sunnier weather experienced in the North East during this period, the accessibility of greenspace or cultural differences in the use of greenspace. Here urban data is valuable in highlighting patterns but requires further study to be understood.
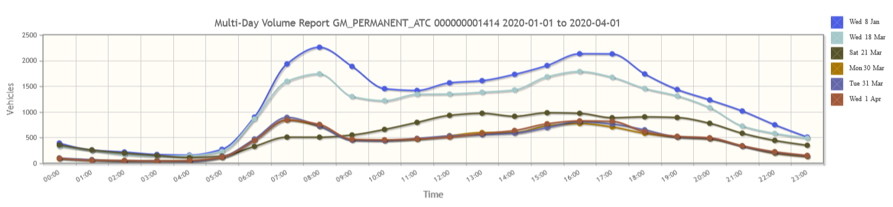
Changes in the movements of people also created a significant decrease in car use, with data taken from Transport for Greater Manchester indicating that roads across Greater Manchester experiencing a drop of 50-80% in traffic. The graph below shows the number of vehicles travelling along the A34 past the University of Manchester for selected weekdays from January to April 2020. Under normal conditions (blue line) the road carries more than 1500 vehicles per hour for the entire day between 7am and 7pm, roughly equivalent to one every two seconds. After lockdown (red line) this fell by about two thirds.
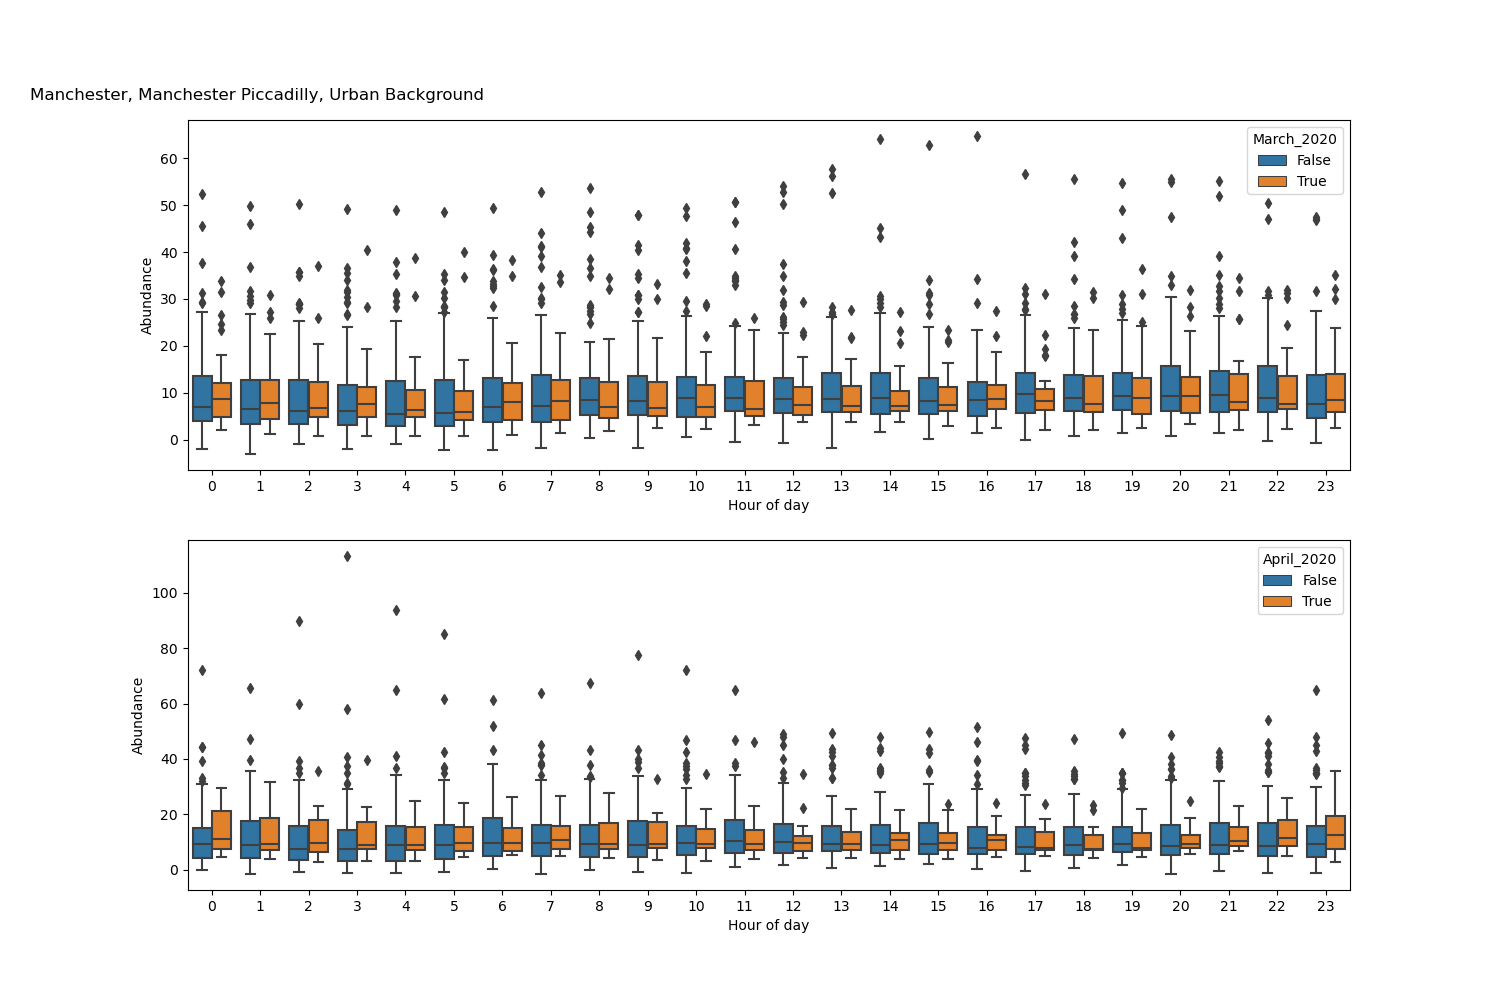
This section of the A34 runs past major residential areas and presents an interesting natural experiment concerning the impacts of reducing traffic on air quality. Air quality readings are hugely influenced by weather conditions, so this requires a predictive model that can account for what air quality levels would normally have been like in the absence of lockdown. The graph below shows actual diurnal levels of NO2, Nitrogen Dioxide, in micrograms per cubic metre (µg.m-3) measured in Manchester Piccadilly for March [top row] and April [bottom row] this year, compared against levels observed from the same months between 2015 until now. NO2 primarily gets in the air from the burning of fuel and thus forms from emissions from the transport sector in the UK.
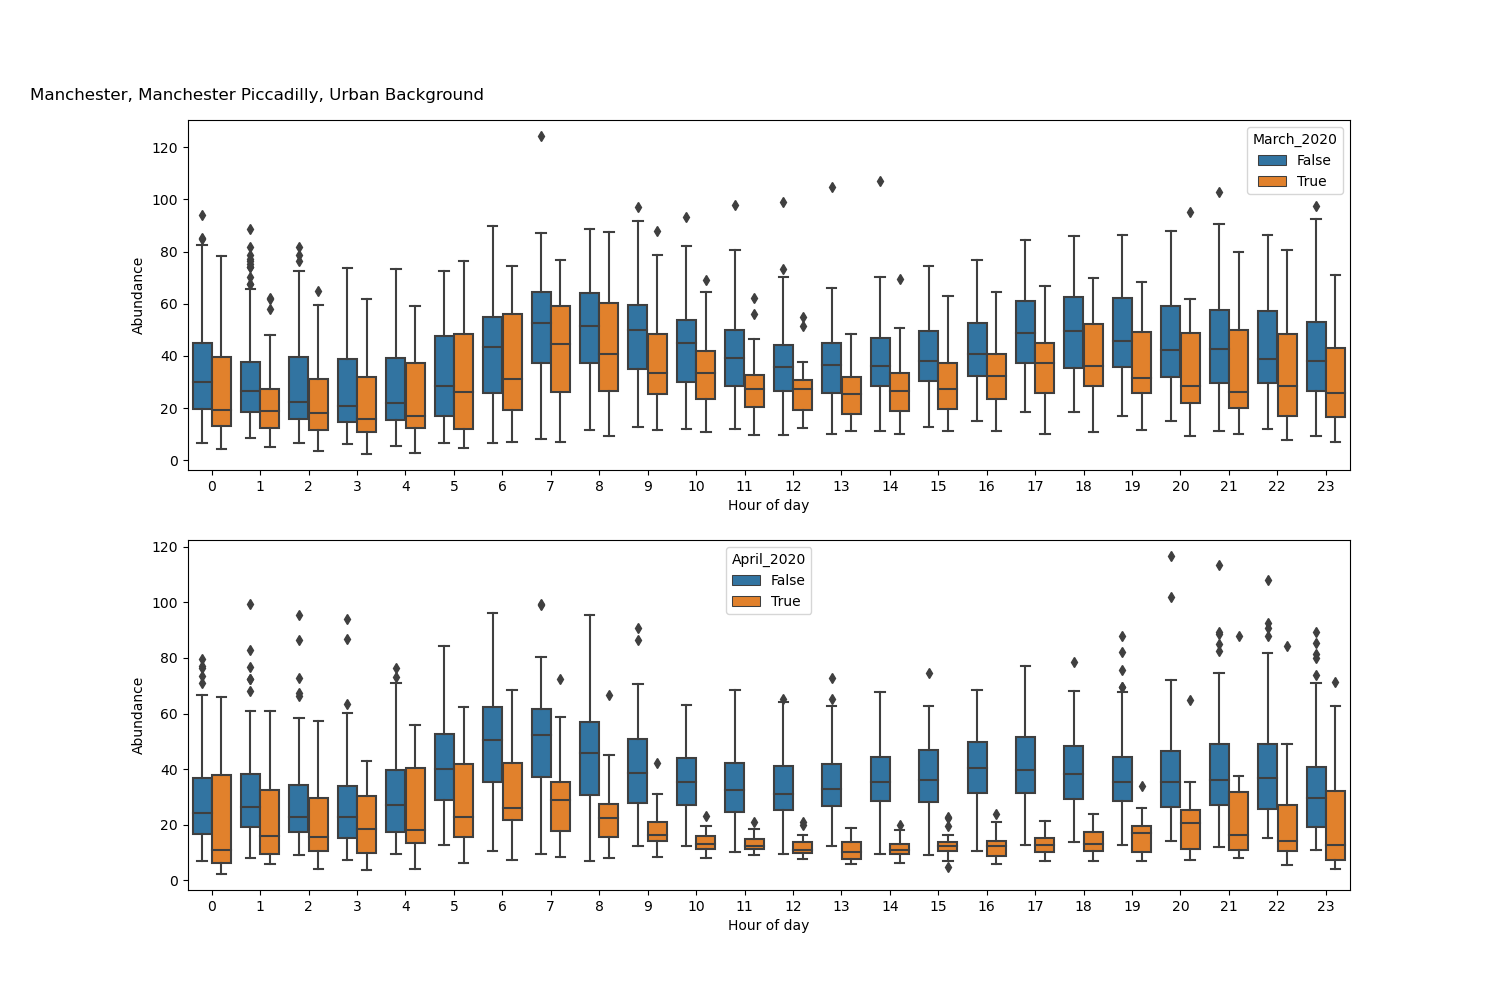
The impact of weather on levels of pollution can be significant. Whilst we did witness a change in conditions from somewhat stagnant to brisk northerly flows from the 27th onwards, the significant drop in the midday levels in April is supported by the change in traffic levels during those periods. Particulate matter, or PM, can be a complicated product to interpret. For example, the following diurnal plot of PM2.5, or the mass of particulate matter smaller than 2.5 microns, shows barely any change in loadings from March and April this year compared to the past 5 years.
Whilst traffic does contribute some PM to measured mass loadings, these particles are rather small and PM is also composed material from other primary and secondary sources. Indeed, in urban environments, road vehicles are the major source of ‘ultra-fine particle’ emissions, classified as smaller than 100nm, or 0.1 microns. The Manchester Urban Observatory is investing in technology for monitoring both size and number concentrations so we can extract important source contribution detail lost in PM2.5 metrics. Unravelling source and process contributions to PM is important. In theory, unintended side effects of changes in personal behaviour as a result of the lockdown may offset some of the benefits in NOx reductions. For example, the reduction in municipal collections of garden waste might have increased the amount of burning taking place, while the increased occupation of homes could have increased the use of log burners. Both of these activities could generate significant amounts of PM2.5. Unintended changes like these show the importance of being able to look at data from different sources to understand what is happening. Again, weather conditions play a significant role in determining the source and process contributions to the PM we are exposed to.
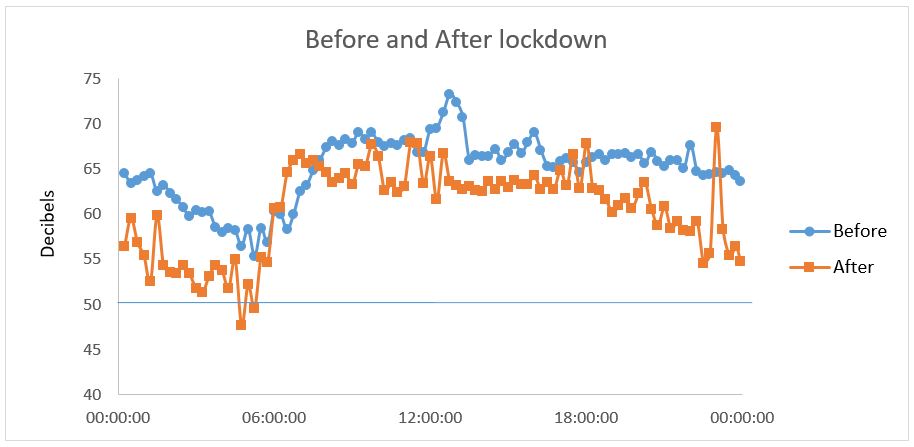
Looking at other variables connected to traffic provides a way around this. The graph below shows data taken from a noise meter in Ardwick placed alongside Brunswick Street. The Manchester Urban Observatory has been working with residents to help understand key problems that impact their quality of life as part of the LOOPER project. For residents in this area, it was the quantity of traffic passing along this street causing noise and safety issues. The World Health Organisation has identified noise as a key determinant of quality of life, impacting mental health and the educational achievement levels of children in particular. The graph below plots the average Monday against the Monday following lockdown, as well as showing the noise limit defined by the World Health Organisation as ‘annoying’ (thin blue line). Data suggests that the street is 5-10 decibels quieter following the lockdown on the 23rd March, and removed all peaks above 70dB, which is the level at which hearing can start to be damaged by prolonged exposure. The benefits of lower noise levels are significant for mental health, which is increasingly critical for especially disadvantaged populations under lockdown. Data from our traffic cameras on the same street confirmed that the spike on the orange line just before midnight is associated with a speeding driver.
The Coronavirus lockdown has transformed human activities and urban data can help show how. The lockdown produces insights into the potential benefits of clean air schemes to reduce the number of private cars in cities. A 2018 report by Kings University identified that reducing PM2.5 and NOX by one third in Greater Manchester would add 3.5 months on to every single person’s life expectancy and save the region £500m per year. The lockdown has reduced NO2 pollution levels by more like a half, and the value of cleaner air is increasing given the proven link between air pollution and vulnerability to Coronavirus. Urban data can also be used to assess the effectiveness of lockdown measures in terms of reducing interactions in specific types of places. Work at our sister Urban Observatory in Newcastle has also shown how Artificial Intelligence can interpret data from cameras to identify places where social distancing is not being practised. By capturing movements around the city urban data can help decision-makers understand how to manage Coronavirus transmission more effectively, focusing on specific areas. To make this a reality privacy must be respected, corporately owned data must be opened up, and resource must be directed to synthesise the mountain of existing data into intelligence that can be used by governments. GDPR covers the first of these challenges. Coronavirus and public opinion are shifting the second. The real challenge is the third one, and it is surely where universities have a critical role to play.
James Evans, Dave Topping, Tom Bannan, Joe Rees, Ettore Murabito, Ann Gledson, Matthew Harrison.
Contact us
+44 (0) 161 306 6000
0 Comments