Lauren Stella: 200 years of EDI Data Workshop and the Importance of Representation through Data
Data is being collected everywhere, even as far as our internet browser cookies noting how long we hovered over the “PAY” button before committing. But a lot of collected data can be important to understanding real social problems. Examples of this includes the inclusion of different diverse groups within the workplace and Higher Education, which we will be looking at in more depth.
I am the Data Analyst Assistant working within the Equality, Diversity, and Inclusion (EDI) Directorate. In this blog post, I will re-cap on the “200 years of EDI Data Workshop” I presented alongside Sami Karamalla-Gaiballa (Data Analyst Lead and EDI Partner) in our EDI Conference in June. As we celebrate 200 years of the University of Manchester, this workshop was purposed to demonstrate how data collection has changed over the past 200 years using examples of the UK Census and our own University.
First Census
The first ever UK Census was created in 1801 after concerns on whether there were enough food resources to feed its growing population. Up until this date the UK population was unknown. Since then, the census has been taken at 10-year intervals with the most recent one taken in 2021.
Within this time, data collection technology evolved from handwritten censuses to punched cards to the first IBM computer, and so on. Data collection methodology also changed from recording aggregate data to recording data on an individual basis like how we collect data at the University today. This enables us to understand intersectional experiences. For instance, knowing that our staff cohort has 52% women and 48% men masks more granular information that we only have 1 female black professor working at our University – a fact that is hopefully on everyone’s radar!
Census questions have always reflected the changing interests of the time. Here is a timeline of when each of the protected characteristics (Equality Act 2010) were recognised:
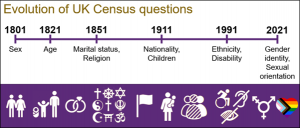
Timeline showing the dates where different protected characteristics were added to the Census questions. 1801: sex, 1821: age, 1851: marital status and religion, 1911: nationality and children, 1991: ethnicity and disability, 2021: gender identity and sexual orientation were added.
Our own Equality Information Report (EIR) and Pay Gap Report have evolved similarly:
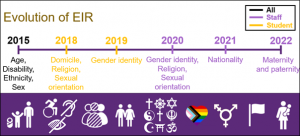
Timeline showing the dates where different protected characteristics were added to the Equality information report, considering staff and student sections separately. 2015: age, disability, ethnicity and sex recorded in staff and student sections, 2018: domicile, religion and sexual orientation included in student section, 2019: gender identity included in student section, 2020: gender identity, religion and sexual orientation included in staff section, 2021: nationality included in staff section, 2022: maternity and paternity included in staff section.
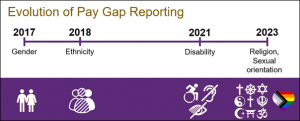
Timeline showing when different pay gaps began to be reported. 2017: gender, 2017: ethnicity, 2021: disability, 2023: religion and sexual orientation pay gaps.
EDI Conference Workshop
In the workshop, we went on to demonstrate differences in our staff population across different characteristics from when it was first reported to today. Main differences included:
- Majority of staff belonging to 26 to 35 age group in 2015, and 36 to 45 age group in 2024.
- Increased proportion of disabled staff from 8.9% in 2015 to 13.3% in 2024.
- Increased proportion of Black, Asian and Minority ethnic people from 16.3% in 2015 to 19.6% in 2024.
- Increased proportion of female Academics from 41% in 2015 to 45.3% in 2024.
- Lesbian, Gay or Other sexual orientation (LGB+) staff increased from 7.3% in 2020 to 18.1% in 2024 (known data).
- Staff following different religious groups (excluding Christianity and Judaism) increased between 2020 and 2024.
We discussed data quality and the importance of being counted in the stats. For example, our ALLOUT staff network group campaigned for sexual orientation to be added to the most recent Pay Gap Report based on evidence of this gap being as significant as the gender pay gap, requiring it to be monitored. This should further encourage others to share their sexual orientation so that we get a better picture of barriers to our LGB+ community, where LGB+ talent is not being retained, and monitor impact of intervention strategies put in place.
We ended the workshop with a breakout session asking the audience to look through the EIR 2024 and “pick out their favourite statistic”. The produced discussions on what needs to change, explanation of data trends and what they would like to see in upcoming EIRs.
Such sessions are important for conveying the importance of data collection and analysis within our University, for alleviating concerns on what happens to your data, and ergo encourage staff and students to update their EDI data within MyView. If you would like to participate in such data sessions, we will be running Lunch & Learns throughout July.
Lauren Stella – Data Analyst Assistant in the Equality, Diversity and Inclusion Team


Contact Us
+44 (0) 161 306 6000
0 Comments